REMEK! Momentum Pro standalones - Documentation
Part 3: Methodology
The basics
Each Edition in the Remek! Momentum Pro product line is a semi-automated system. As with any computerized trading strategy, human supervision, disciplined execution, sound analysis, proper risk management rules and common sense are advised when using the program.
Remek! Momentum Pro is programmed so that it can be used on any instrument available in NT8, on any timeframe and on any bar type, with tick charts, time-based charts, range charts being the most popular choices (subject to proper quantitative validation). Testing with various settings is recommended to find the timeframe and the bar type that best aligns with your own trading style, preferred timeframe, account size and risk management rules. (If trading intraday, start e.g. with 1000, 2000 or 3000 tick intraday charts, or, alternatively, 15 minute or 30 minute charts on your preferred instruments. Overnight traders can start with a 4hr or daily chart. Range charts can also yield excellent results, experiment with various settings, depending on the average volatility of the given instrument.)
The psychological journey ahead
Before we delve further into the technical and quantitative aspects of trading, let’s also stop for a moment to consider the psychological landscape ahead, so rich in traps, from cognitive biases to misconceptions (see image on the right).
Your guiding motto should be:
“It ain’t what you don’t know that gets you into trouble. It’s what you know for sure that just ain’t so.“ – Mark Twain
The Remek! method
Entry: The system waits for the market to make a significant move away from equilibrium. On the chart this will typically shown as a forceful move that will push price to the edge or outside of our Keltner channel. At that point, the system waits for price to return to the mid-area. As price leaves the mid-area again in the direction of the first momentum move,
- the system, if enabled, enters the trade upon the arrival of a trigger as new momentum emerges
- the system can also send a sound or email alert, which can also be used by the trader to enter the trade manually.
- the system can also identify trades setting up in Remek! Market Scanner Pro. This feature can give ample time to prepare for the actual trigger of a trade.Trade management: Consistent trade management is paramount, and is ensured by the custom ATM in PRO STR or built-in self-adjusting NT8 strategy in PRO STR BT/X. Trade management rules can be adjusted and customized in all Editions:
- PRO STR: in the ATM settings
- PRO STR BT/X: in the settings of the built-in self-adjusting native strategyExit:
Exit rules can be adjusted and customized as follows:
- PRO STR Edition: Trades, including targets and initial and trailing stops, are managed consistently by the customizable ATM.
- PRO STR BT/X Editions: Trades, including targets and initial and trailing stops, are managed based on volatility as measured in ATRs by the customizable strategy parameters of the built-in self-adjusting native strategy.
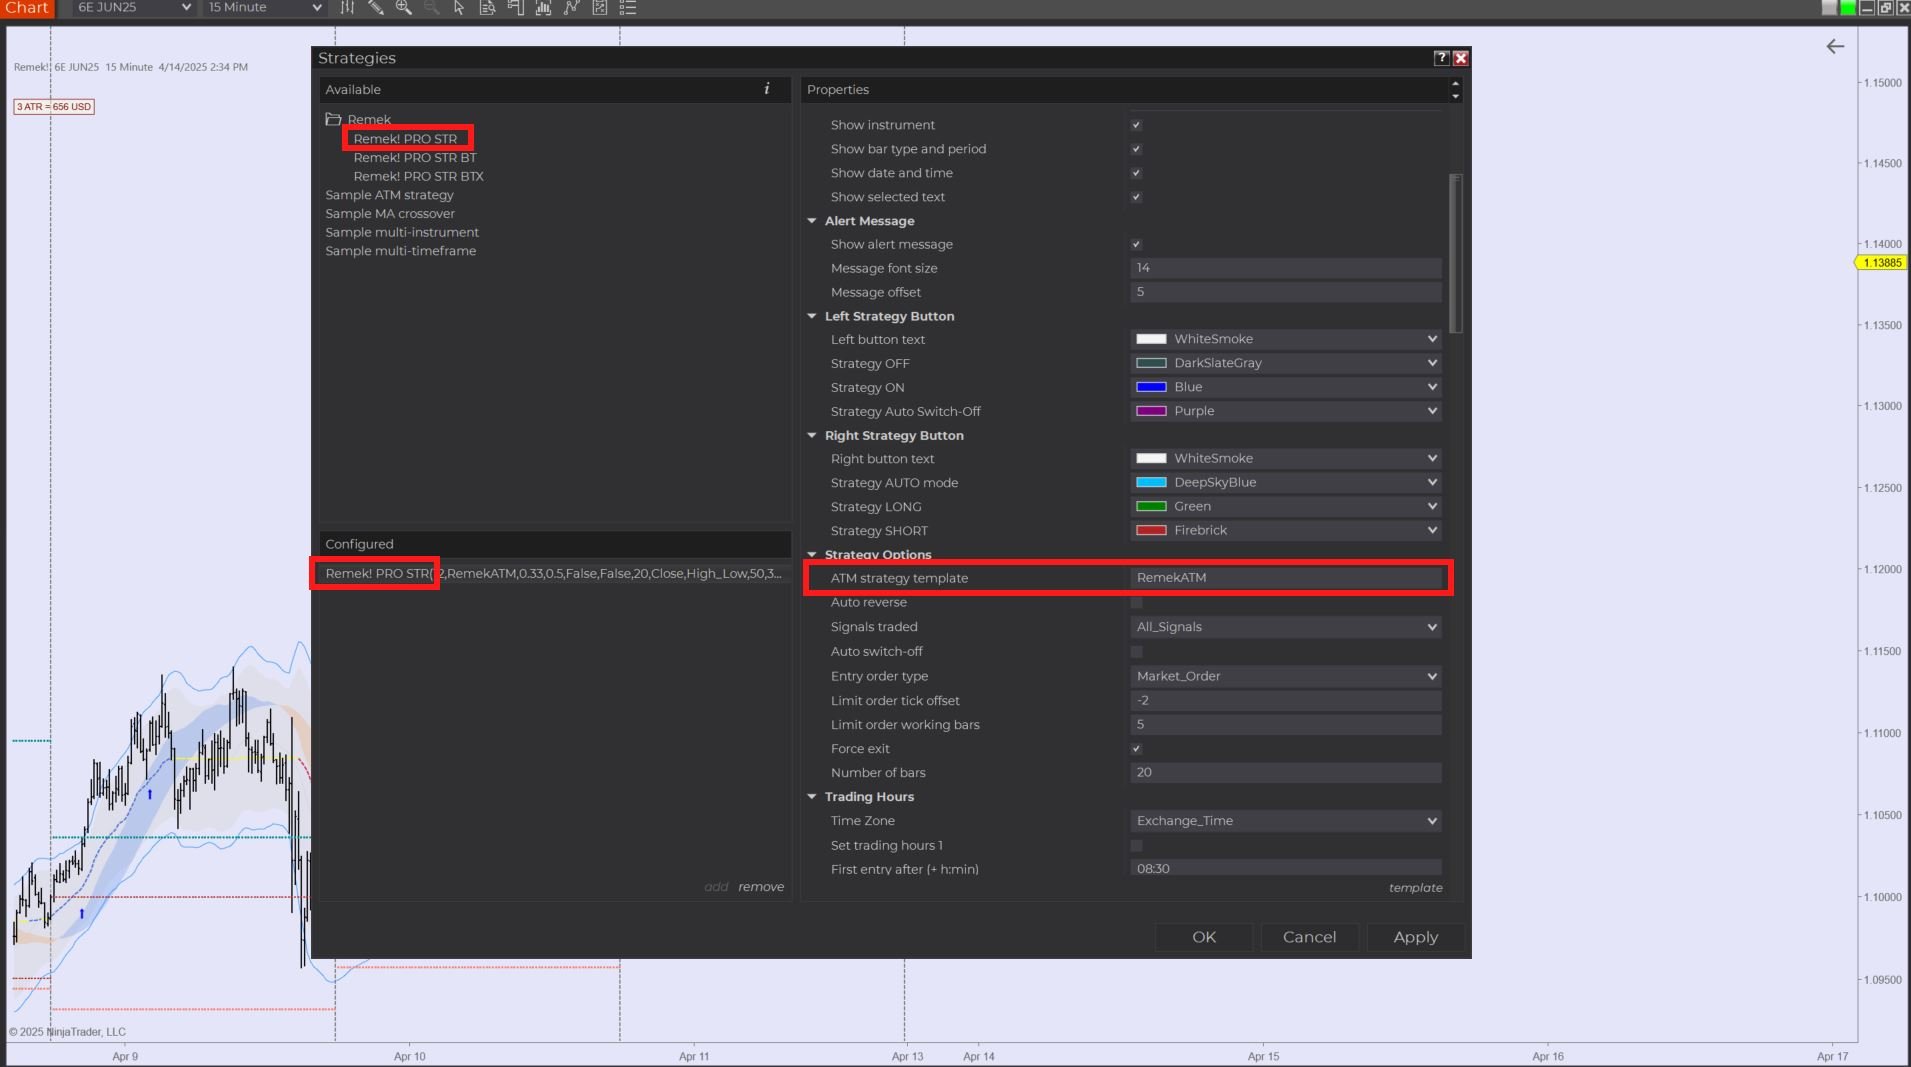
PRO STR uses an ATM. Make sure you specify the ATM you want to use with PRO STR. (PRO STR comes with a sample ATM “RemekATM”, which you can customize to your needs). (Note: PRO STR BT does not need an ATM to be specified, because it has its own built-in, extremely advanced, volatility-based trade management engine with automated risk management.)
Using Remek! Relative Return with Remek! Momentum
Remek! Relative Returns (aka RRR or “triple R” is the indicator at the bottom of our daily chart and also a column in our Remek! Market Scanner Pro. RRR measures the the daily move in relation to the average move of the past x number (20, by default) of days. Since an increase in volatility tends to lead to more volatility in the financial markets, it is a powerful ingredient of our tading method. It can be used in two ways:
on the dialy chart, with a setting of 1-20, it can identify increased market volatility, giving us important clues for the next trading session
with a setting of e.g. 20-20, it helps to identify, on any chart, persistent momentum (see 15m chart).
Remek!MACD (daily chart, second indicator from bottom) is the modern version of the classic 3-10 Oscillator, providing a visual clue to emerging momentum on our trading timeframe.
USING THE REMEK! MOMENTUM WORKSPACES - Futures, foreign currency and options trading contains substantial risk and is not for every investor. An investor could potentially lose all or more than the initial investment. Risk capital is money that can be lost without jeopardizing ones financial security or lifestyle. Only risk capital should be used for trading and only those with sufficient risk capital should consider trading. Past performance is not necessarily indicative of future results.
Moving towards higher timeframes
Trading above the largely random noise of very small charts, on timeframes at the boundary of intraday and overnight trading, in other words, above the intraday noise but still below the level of interest of large players, deserves consideration. Consider the 240m chart: the 240m timeframe is sufficiently above the often random noise, while still offering the option to choose between exiting at the close of the day or staying overnight for larger moves. With well-planned, disciplined trade management on a validated timeframe, excellent results can be achieved.
Utilizing multiple timeframes and workspaces
Remek! Momentum PRO STR as well as BT/X allow you to quickly identify emerging setups, both visually on the chart and via the Remek! Market Scanner (or Market Scanner Pro), in a multiple timeframe context. By switching between the Single and Multiple Instrument Workspaces you are able to plan and execute your momentum-based trade in the most optimal manner. (See video on the right.)


