Remek! Premium user guide
Part Two
The basics, revisited
In order to be successful, the following facts must be carefully considered:
Financial markets move, mostly but not always, randomly.
It is mathematically not possible to have a positive edge in a random environment.
Therefore traders must
a) find situations when the market is, most likely, not random
b) define what they will do at those, and only those, times
c) do it consistently, so as not to increase the level of randomness of the environment they operate in.
So far so good. But there is one problem: it is not possible to identify non-random situations with a 100% accuracy. We never know with certainty if the environment we are in during any trade is random or non-random, in other words: if there is
a) an actual imbalance between buyers and sellers and that’s what is creating the price movement, or
b) we are merely looking at random noise.
Consequently, in trading, there is no such thing as a 100% certainty. We never know anything, the best we can do is a calculated guess based on math, based on probabilities.
Accepting the above is challenging. This environment is unlike most other environments we as humans must function in our daily lives. Operating consistently under constant uncertainty, and learning to make decisions with significant consequences in a probabilistic environment is the hardest part, but also an unavoidable part, of becoming a professional trader.
On patterns
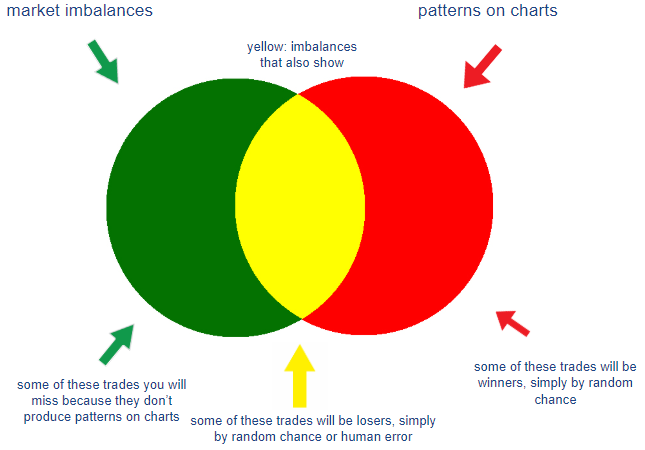
Let’s now talk about patterns. If you think you trade patterns, you’re wrong. Professional traders do not trade patterns, they trade market imbalances, because it’s market imbalance that moves price. You will also want to trade market imbalances. Since the only thing that moves price is the imbalance between buyers and sellers, identifying market imbalances is our primary goal as traders.
What is the difference, you might ask, between patterns and market imbalances? Aren’t they the same? The answer is no. While it is true that market imbalances often manifest themselves on charts as patterns, they do not always do so. As you will see in the next paragraph, not every pattern is a result of a market imbalance, and not every market imbalance shows as a pattern on a chart. This means that when you see a pattern on the chart (e.g. a bullflag), it could be a) the result of a real imbalance between buying and selling pressure or b) it could be just random noise that simply looks like a pattern by accident.
Consider the Remek! Random Chart Generator. Try entering different numbers in the yellow field. Print the chart or grab the mouse, and mark those excellent bullflags, bearflags, trendlines, wedges, your favourite (and useless) fibonaccis, and anything else you fancy on the chart. Then spend a minute thinking this over: you just marked up random data. Your markups mean nothing. See b) above.
What this means:
1. IF our brain finds bearflags, bullflags, trendlines and whatnots on a chart of random data,
2.AND IF the market is mostly random data
3.THEN at least some of those patterns on a real chart will be there just by pure chance.
Let’s separate the chance patterns from the real patterns, I hear you say! There surely is an indicator, a magic line, a secret sauce or a guru trader that can do it!
Well, the problem is, this is simply not possible. And the sooner you accept this, the faster your journey will be towards successful trading. You have to accept that a portion of your trades, however excellently executed, will turn out to be losers, because they were based on “patterns” that were created by random market data and were on the chart by chance. (We will call these “patterns” pseudo patterns.) And since you have no way of knowing if the pattern you picked to trade is a real pattern (based on buy/sell imbalances) or pseudo pattern (a result of random chance), you should never feel bad about an excellently executed trade that turns out to be a loser!
what can we do?
What we can do is to improve our accuracy in identifying less-than-random situations, and restrict our participation to those times. Within the Remek! Momentum framework we use in Premium, we do this
by putting the given trade setup into a discretionary context, based on insight, experience and intuition gained from following our charts every day for a decade, and
by insisting to be triggered into any trade only by the re-emergence of momentum, i.e. by price movement in our direction (marked by a red circle and our 1R* target/stop levels on our Premium charts).
At the other end, in the case of losing trades, we cover our backs by
not overstaying our welcome and removing partial profits at pre-defined levels (usually at 1R), and
by respecting our stops at all times.
When at our trade desk, we will do our best to guard against our own cognitive biases. When done well, this will improve our accuracy by eliminating some of the randomly produced (psudo) patterns. That way, what we’re left with has a better chance of being a less-than-random - and thus a more predictable - pattern.
Ok, let’s move on to see how the Remek! Premium service can help!
*1R means our reward equals our risk, i.e. our target and our stop loss are the same distance from our entry.


