Remek! Relative Strength Documentation
With Remek! Relative Strength, our new indicator built for NT8, you can compare the returns (aka percentage change) of two assets. Let’s call the two assets A and B. We will use one of the assets as the benchmark (say “A”). We want to know if “B” has outperformed “A”.
Let’s say we trade stocks and want to know if a certain stock or asset (say, “B”) has outperformed or is outperforming the market as a whole (a benchmark, say, “A”, e.g. the Dow Jones Industrial Average ^DJI).
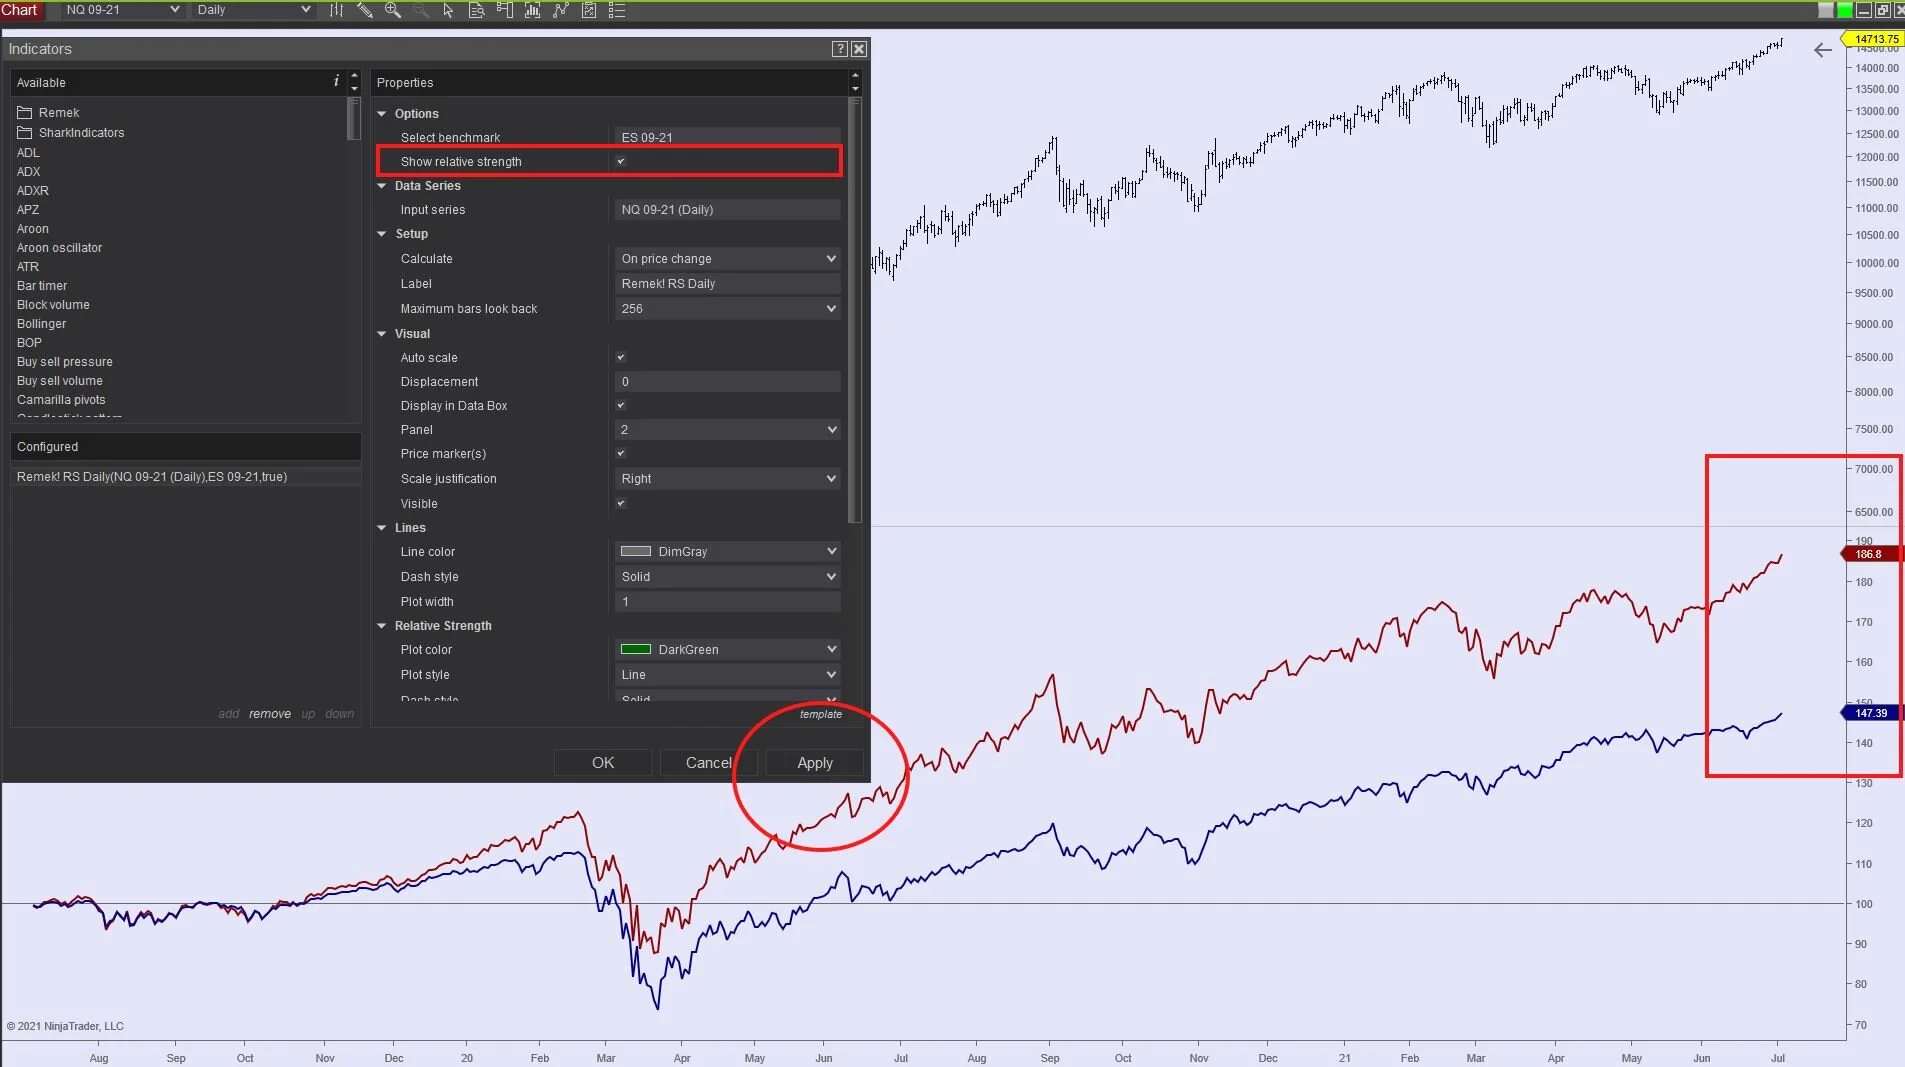
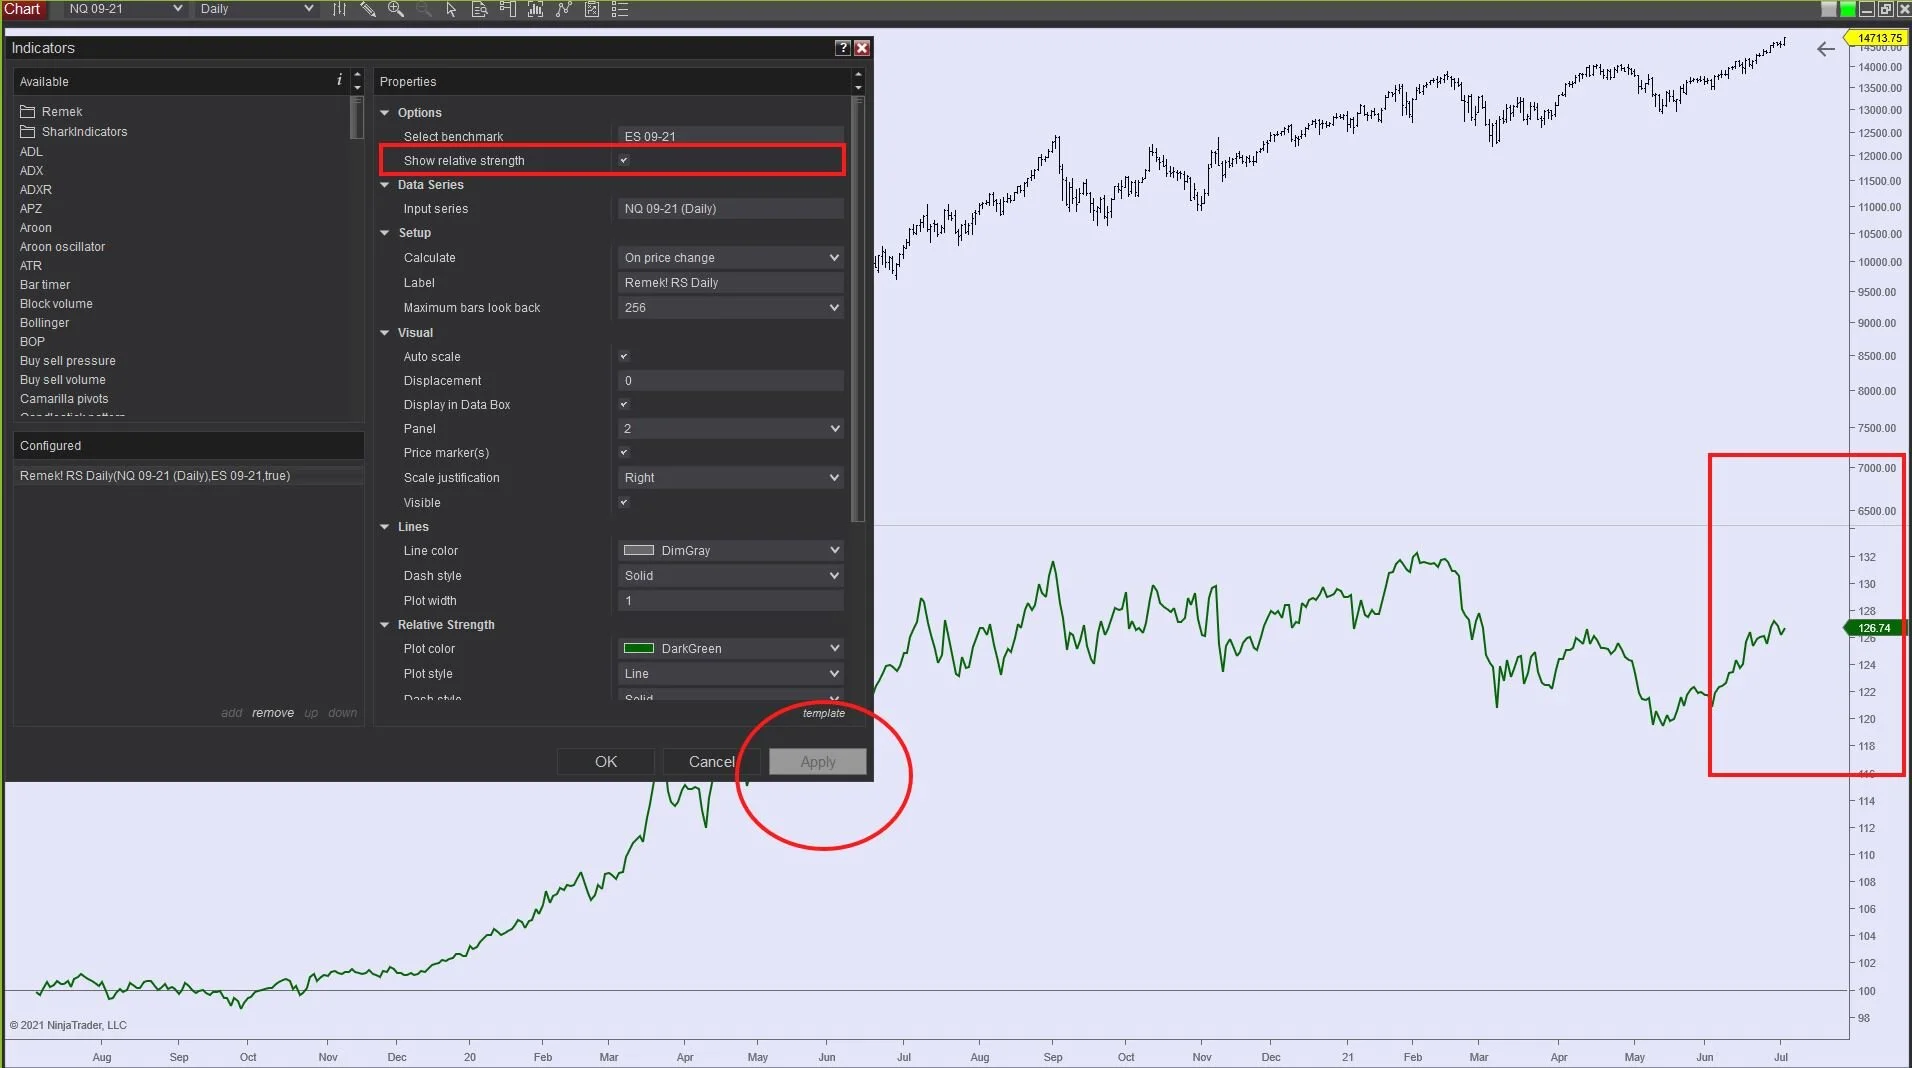
In the image below, ES 09-21 is the benchmark (“A”), and NQ 09-21 is “B”, the instrument on the chart. As we can see, the NQ has outperformed the ES in our chosen lookback period. (Notice that in the first image each asset plots its own line, blue and dark red.)What if we do not want to plot both returns, we only want to plot the actual difference between the two returns? Simple: just check the “Select relative strength” option (see below). Now only the difference between the two returns (the actual degree of outperformance) is shown in the chart (see green line on image 5).


Now while this is great, but what if we want to follow dozens or hundreds of different assets and know the outperformers in real time? Simple: Remek! Relative Strength is fully compatible with our Remek! Market Scanner/Pro as seen above in image 6. Any number of instruments you follow can be added to Remek! Market Scanner/Pro, so you’ll always know which ones are outperforming your benchmark. (This information can be a significant ingredient of your edge.)
Remek! Relative Strength can be enormously useful for stock traders, currency traders and futures traders alike. Its usefulness for stock traders is rather obvious, so let’s see how it can provide useful information for currency and futures traders:
a) currency traders may want to choose the DX as the benchmark and thus always know which major currency pairs may be outperforming the others against the USD.
b) futures traders can compare correlated assets in a given asset class (say, GC/SI or CL/HO or ZC/ZS/ZW or ZB/ZN etc.) to gain crucial insight about how individual markets may be evolving on a given timeframe.
Notes
The calculation behind RRS, while simple in principle, is complex in execution. You’ll notice that RRS comes with three files: RS Daily, RS Minute and RS Tick (see image on the right). This solution allows us to use this indicator on any of these three bar types and on any timeframe, while still maintaining absolute precision and accuracy of all calculations under the hood. A warning message will ensure the appropriate file (e.g. RS Daily on daily candles, RS Minute in minute bars and RS Tick on tick charts) is used at all times for maximum accuracy.
The install file contains the following bonus files for PRO STR and PRO STR BT/X users:
- the respective Market Analyzer templates so you can simply load the RRS template and be up and running in a minute
- the respective NT8 RRS workspace files for those users who want to use Remek! Market Scanner Pro with the RRS column.
If you own PRO STR and/or PRO STR BT/X, and have purchased RRS, simply load the appropriate workspace ending with “RRS”, to be up and running instantaneously.
Chart templates with the benchmark and chart instruments can be saved as a template for easy recall. See image on the left.
Questions? Just send us a line, we’ll be happy to help!


