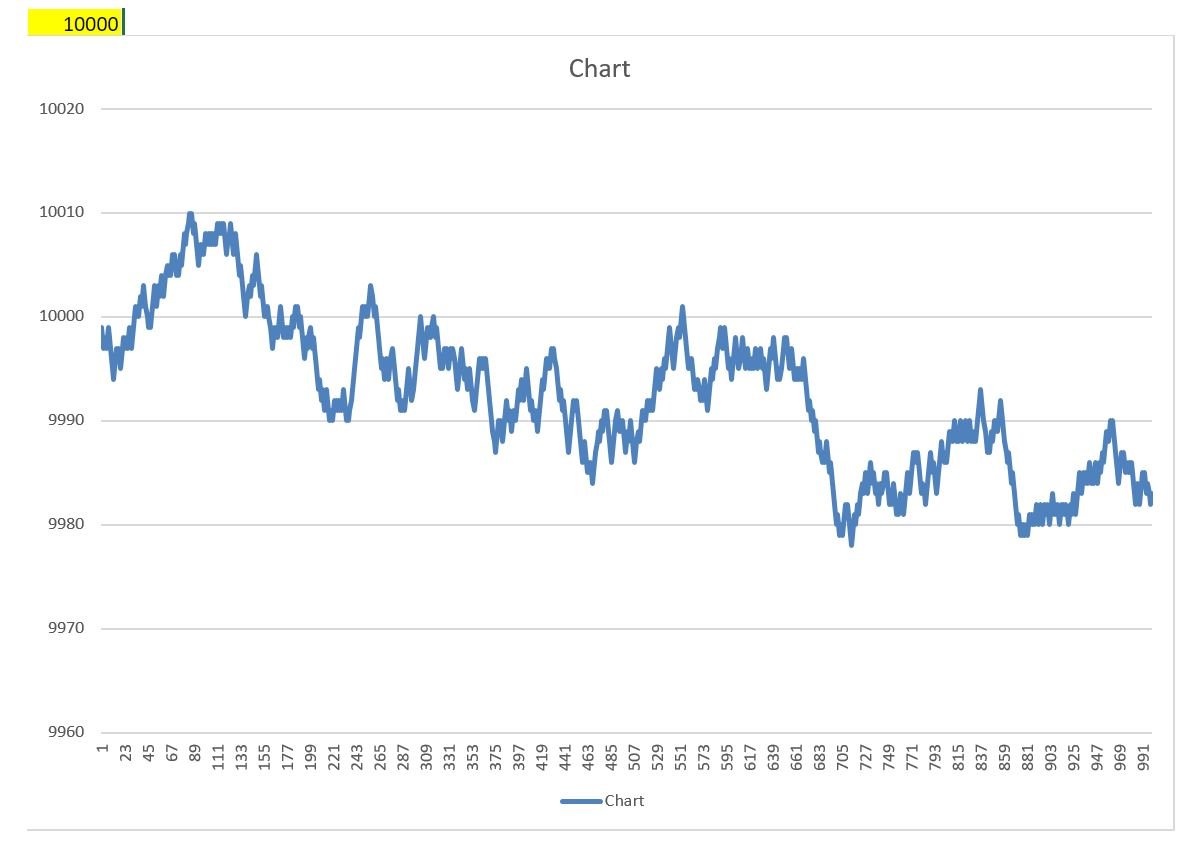
Enter any number in the yellow field to generate a random chart (courtesy of MsExcel). As you'll see there will be "support" and "resistance" levels all over the place. Since these are random, nonsense data, those "support" and "resistance" lines and any other "setups" obviously mean nothing.
You could also find lots of amazing fibonaccis and Elliott waves and what-nots on these nonsense charts. They, too, are just random chance, and mean nothing. Consider this next time you look at a real chart. That thing on the chart, that looks so good, could be just random chance. Or could be a great setup. Which gives: managing risk is Job 1.
Enter any number in the yellow field to generate a random chart.

