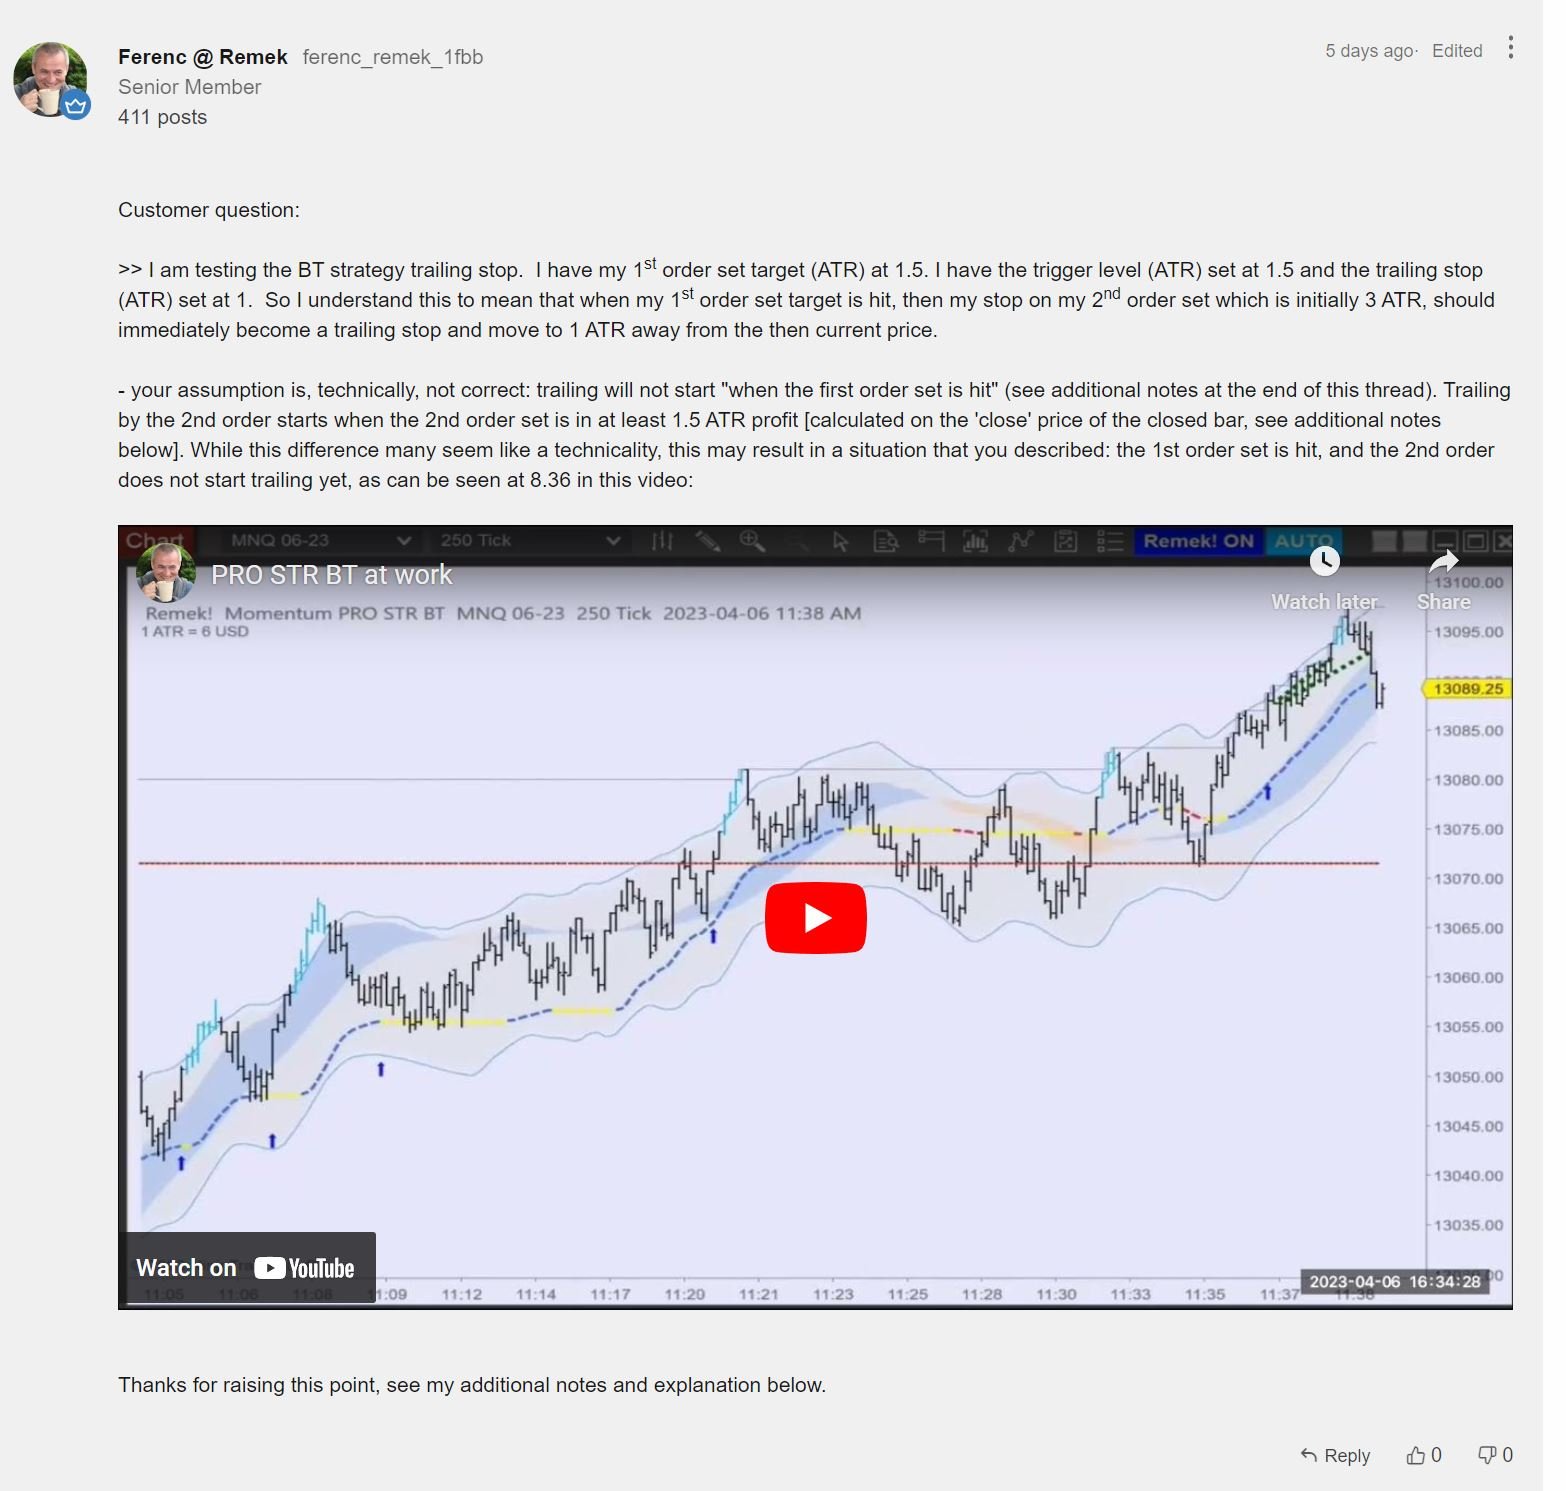
The weekend is always a good time to do some deep thinking. Spend a few minutes on this chart, follow the process and make sure you understand the most important thing in trading:
when we enter a trade there is no way of knowing if the pattern we entered is
a) the result of an actual market imbalance or
b) a random event that looks like a pattern.
We always want a) of course, but as we trade, we’ll often end up in b). To make things a bit more complex, winners and losers can happen as a result of both a) and b). The market is like a piano teacher who will randomly praise or scold us no matter how much we practice, or how good is our performance. Talk about a challenging environment!
The good news is, once you understand the environment you’re in, you’re on your way to devise strategies for success. Like understanding the predictive characteristics of crowd behaviour that are bound to surface over a large sample size, and designing software that capitalizes on them. (And designing such software is one thing we at Remek! have been doing for 14 years now.)
By the way, the release of v3.50 of Remek! Momentum Standalones (PRO STR/BT/BTX) is just around the corner. With the new risk management module, it’s algorithmic trading at a whole new level! Make sure you’re in the loop: sign up to our mailing list and follow these pages!


